“Should we build this business?”
It looks like one question. It is not.
Hidden inside it are several different questions wearing one oversized coat:
- Is the customer problem painful enough?
- Who already solves it, and how well?
- Can we reach the people who have the problem?
- Will they pay enough to support the economics?
- Can we build and operate the product responsibly?
- What would have to be true for this to become a good decision?
Ask an AI the original question and it will usually give you an impressively tidy answer. There will be a market summary, a few risks, perhaps a recommendation, and almost certainly the phrase “conduct further research.”
The response may be useful. But its neatness hides the problem: you cannot easily see which assumptions shaped the answer, which evidence deserves trust, where two findings contradict each other, or what would change the recommendation.
We often blame the model when the real design failure happened before the prompt was submitted.
We asked one system to research, interpret, challenge, calculate, prioritise, and decide in a single pass. Then we treated the fluency of the final paragraph as evidence that every hidden task was performed well.
There is a better way to work.
I think of it as graph engineering: turning a complicated question into an explicit network of smaller tasks, dependencies, checks, and decision points.
The name is less important than the shift behind it.
Do not ask AI to produce an answer when what you actually need is a decision system.
A prompt is a request. A graph is an operating model.
The simplest way to use AI is conversational:
Question → Answer
For many tasks, that is exactly right. You do not need an orchestration layer to rewrite an email or suggest ten names for a workshop. Sometimes a prompt should simply be a prompt.
Complex decisions are different. They contain work that can happen independently, work that depends on earlier findings, and work that should not proceed until somebody checks the evidence.
A graph makes those relationships visible:
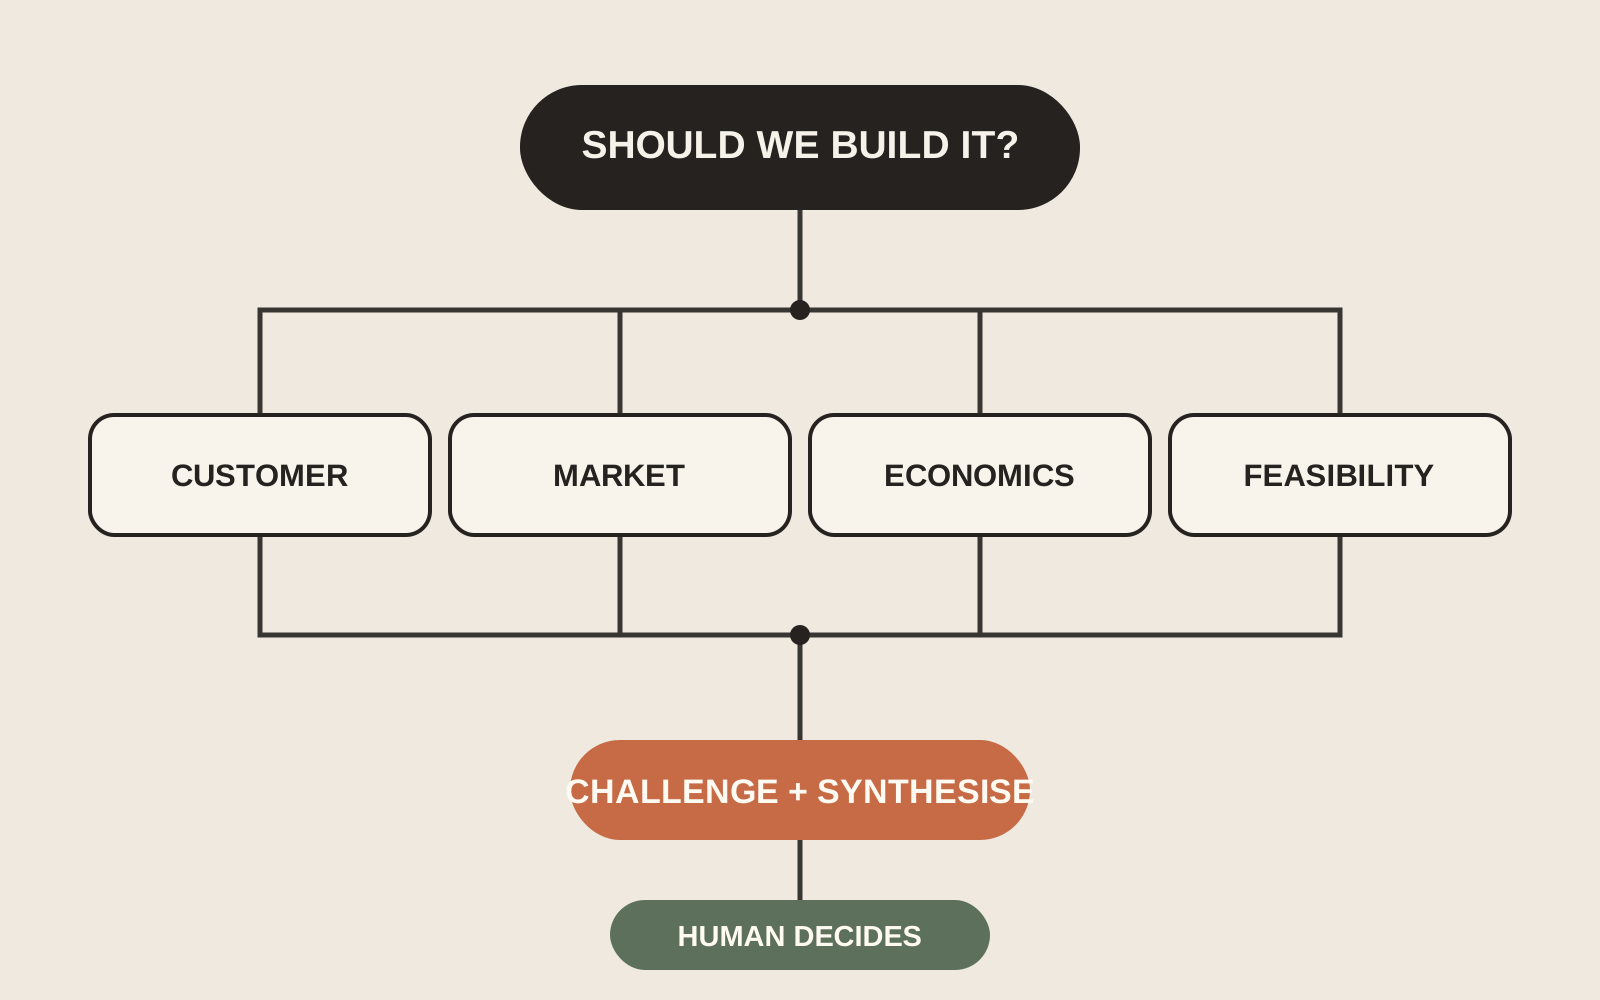
In software terms, a graph has three basic parts: nodes that perform work, edges that determine what happens next, and state that carries information through the workflow. That is also how LangGraph describes its graph model. A node might use an LLM, ordinary code, a search tool, a database, or a human reviewer. The graph is not “made of AI.” It is made of decisions about how work should move.
This matters because the phrase AI agent can make everything sound more autonomous and mysterious than it needs to be.
Many valuable systems are workflows rather than free-roaming agents. Their paths are mostly predetermined. They use AI where interpretation is useful, code where determinism matters, and human judgment where consequences or ambiguity are high. The current LangGraph workflow guidance makes the same useful distinction: workflows follow predefined paths, while agents dynamically choose their own process and tools.
Graph engineering is therefore not mainly about adding more agents.
It is about designing the work.
The giant-question problem
Suppose the question is:
Should I build an AI bookkeeping product for Shopify merchants?
A plausible answer requires several kinds of reasoning:
| Investigation | What it must establish | Typical failure |
|---|---|---|
| Customer pain | Which bookkeeping tasks create frequent, costly friction | Mistaking online complaints for representative demand |
| Competition | Which direct tools and substitutes already exist | Producing a feature list without explaining switching behaviour |
| Market | Whether a reachable segment is large enough | Inflating a broad market into a relevant one |
| Distribution | How the product could acquire trust and attention | Assuming “content and partnerships” is a strategy |
| Economics | Pricing, service costs, margins, and support burden | Treating subscription price as profit |
| Feasibility | Data access, integrations, accuracy, and maintenance | Confusing a prototype with a reliable product |
| Risk | Financial, regulatory, security, and reputational exposure | Hiding serious constraints in a final paragraph |
These investigations interact, but they are not interchangeable. A researcher studying customer pain should not quietly invent the market size. A pricing analysis should not proceed as though every merchant has the same transaction volume. A technical assessment should not conclude that an API makes a trustworthy bookkeeping product “easy.”
One giant prompt encourages premature synthesis. The model starts writing the final story before the component questions have earned their answers.
Decomposition does not magically make the model correct. Research on deliberate problem solving has shown that exploring and evaluating multiple reasoning paths can outperform a single linear generation on selected planning and search tasks. The well-known Tree of Thoughts paper demonstrated large gains on three constrained tasks, including the Game of 24 and mini crosswords. That is evidence that structure can help on some problems, not proof that every business question needs a forest of agents.
The practical case for a graph is more modest and, I think, more useful: it gives us places to inspect the work.
The seven nodes of a useful decision graph
I would design a business-evaluation graph around seven kinds of node.
1. Frame
Before researching anything, convert the vague question into a decision brief.
Define the intended customer, geography, business model, time horizon, constraints, and decision criteria. “Should we build it?” becomes something closer to:
Should we invest four weeks in validating an assisted-bookkeeping product for small Shopify merchants in one market, given our integration capability and need to reach paid demand without a large sales team?
That sentence is not glamorous. It is, however, far more useful than a confident answer to the wrong question.
The framing node should also state what the workflow will not decide. Perhaps it can recommend whether to run a validation experiment, but not whether to invest a year of capital. Good graphs have boundaries.
2. Plan
The planner turns the brief into research tracks and specifies the output expected from each one.
It should identify dependencies. Customer segments influence market sizing. Product scope influences technical feasibility. Distribution economics influence acceptable pricing. If everything runs in parallel without shared definitions, the graph creates several polished answers to slightly different questions.
The plan is also where we decide which tasks require AI at all. A margin calculation belongs in code or a spreadsheet. Current competitor pricing requires source retrieval. Interpretation of interview notes may benefit from an LLM. Approval of a risky recommendation belongs to a person with authority.
3. Investigate
Specialist nodes investigate bounded questions using the right sources and tools.
Parallel work is useful when the tasks are genuinely independent. Official workflow guidance describes two common reasons to parallelise: to process separate subtasks faster, or to run several perspectives over the same input for additional confidence. Both can help, but parallel output is not automatically independent evidence. Five agents repeating the same unsupported assumption are not a research team. They are a choir.
Each investigation should return structured findings:
- claim;
- supporting evidence;
- source and date;
- confidence;
- limitation;
- implication for the decision;
- unresolved question.
The structure matters more than the specialist persona. “You are a world-class market analyst” is theatre unless the node has a clear question, credible inputs, and an output someone can verify.
4. Challenge
Every material finding should meet resistance before it reaches the recommendation.
A challenge node looks for missing evidence, contradictory sources, weak definitions, convenient assumptions, and conclusions that run beyond what the data supports. It can ask:
- Does the source measure the segment we are actually discussing?
- Is the figure current and primary?
- Are stated customer preferences consistent with behaviour?
- What alternative explanation fits the same evidence?
- Which assumption contributes most to the recommendation?
This is not a generic request to “critique the answer.” The evaluator needs explicit criteria. Evaluator–optimizer loops are useful when success can be described and revision can respond to specific feedback. Without a stopping rule, the system can spend money polishing sentences while the underlying evidence remains unchanged.
5. Reconcile
The most valuable output of a multi-path workflow may be disagreement.
Customer research might suggest intense pain. Distribution research might show that the affected segment is expensive to reach. Technical research might find that automation is feasible only with frequent human review. Those findings should not be blended into a smooth average.
The reconcile node preserves contradictions and identifies their effect:
| Finding A | Finding B | What the conflict means |
|---|---|---|
| Merchants dislike manual reconciliation | They are reluctant to grant financial-data access | Trust may be the product problem, not only automation |
| Competitors charge low monthly prices | Support and exception handling are costly | A pure self-service model may have weak economics |
| The integration can be prototyped quickly | Accuracy failures carry financial consequences | Prototype speed says little about production readiness |
When a workflow hides conflict, it performs confidence. When it preserves conflict, it supports judgment.
6. Synthesise
Only after the evidence has been challenged and reconciled should the system produce a decision memo.
The synthesis should not be a longer version of the original answer. It should show:
- the recommendation;
- the strongest evidence for it;
- the strongest evidence against it;
- critical assumptions;
- confidence by dimension, not one decorative percentage;
- the cheapest next action that would reduce meaningful uncertainty;
- conditions that would reverse the recommendation.
That final item is essential. “Proceed” is not a useful decision if nobody knows what new evidence should make the team stop.
7. Decide
The graph ends with accountable human judgment.
This is not a ceremonial human-in-the-loop checkbox. The reviewer needs the evidence, the disputed assumptions, the authority to override the recommendation, and a record of why the decision was made. As I have argued elsewhere, human-in-the-loop is a product decision, not a disclaimer added after the architecture is complete.
The person is not there because humans are infallible. The person is there because business decisions contain values, consequences, commitments, and context that should not be laundered through an automated recommendation.
What each node should own
The graph becomes reliable when every node is treated like a small product with a contract.
For each node, define:
| Contract element | Question |
|---|---|
| Objective | What single job does this node perform? |
| Inputs | Which evidence and prior state may it use? |
| Tools | Does it search, calculate, retrieve, classify, or ask a human? |
| Output | What structured result must it return? |
| Quality test | How will we know the result is acceptable? |
| Failure path | What happens when evidence is missing or a tool fails? |
| Owner | Who is accountable for the node and its criteria? |
This is where graph engineering begins to look less like clever prompting and more like software, operations, and project design.
That is a feature.
The model may change. The workflow should still express why each step exists, what it is allowed to do, and how its output is checked.
More agents can create more confidence, not more truth
There is an obvious temptation once the graph appears: keep adding specialists.
Why have one market researcher when we can have three? Why stop at a critic when we can add a critic of the critic? Soon the workflow resembles a corporate steering committee, except every attendee charges by the token.
Complexity has costs:
- More calls increase latency and spend.
- Every handoff can lose context or distort meaning.
- Shared model biases can produce correlated mistakes.
- Synthesis can flatten legitimate disagreement.
- More components create more failure paths and harder evaluation.
- An elaborate graph can make a weak question look engineered.
The safest design principle is simple:
Use the smallest workflow that makes the important uncertainty visible.
Start with one strong prompt. Split the task only when the parts require different evidence, tools, evaluation criteria, or timing. Add a challenge loop when the cost of an unsupported answer justifies it. Add human approval where consequence, ambiguity, or authority demands it.
This follows a broader engineering instinct: match architecture to the problem rather than architecture to enthusiasm.
How to build the first version in ChatGPT
You do not need a graph framework to test the method.
The manual version can happen in one conversation, provided you preserve the state explicitly.
Step 1: Write the decision brief
Ask the model to turn the original question into a bounded decision, list assumptions, and propose criteria. Edit the brief yourself. Do not delegate the objective.
Step 2: Create separate research contracts
For each track, specify the question, allowed evidence, expected structure, and what the track must not conclude. Run the tracks separately so their intermediate work remains inspectable.
Step 3: Maintain a shared evidence table
Record claims, sources, dates, limitations, confidence, and implications. This table is the workflow’s memory. Without it, later synthesis relies on whatever happens to remain salient in the conversation.
Step 4: Run a contradiction review
Ask a fresh pass to find disagreements across tracks, unsupported jumps, missing definitions, and assumptions shared by several outputs. Require it to point to the evidence, not merely express scepticism.
Step 5: Produce a conditional recommendation
Ask for the strongest case for, the strongest case against, the uncertainties that matter most, and the next experiment. Decide what to do yourself and record why.
That is already a graph, even if the edges are you typing “continue.”
Once the sequence becomes valuable and repeatable, software can automate it. A graph framework can persist state, route work conditionally, run independent nodes in parallel, pause for approval, and resume after failure. But automation should follow a useful workflow, not rescue an undefined one.
The graph is also a management tool
The more interesting implication reaches beyond AI.
A visible decision graph exposes how an organisation thinks. It shows whether the team separates evidence from opinion, whether ownership is clear, where approval slows work, which questions repeatedly lack data, and whether decisions preserve their reasoning.
This is why working with orchestrated agents can reveal so much about company culture. Both systems depend on context, boundaries, handoffs, verification, and memory. The difference is that people have become very good at compensating for bad operating design. We fill gaps with meetings, private messages, institutional memory, and heroic last-minute recovery.
An AI workflow is less forgiving. It forces the hidden system into view.
That visibility is the real opportunity.
Graph engineering does not matter because every business needs a digital committee of specialist agents. It matters because important questions deserve an inspectable path from uncertainty to action.
The goal is not to remove the human from the decision.
It is to give the human a decision worth making.
Further reading
- Tree of Thoughts: Deliberate Problem Solving with Large Language Models, for an early research example of explicit search over multiple reasoning paths.
- LangGraph’s Graph API overview, for the practical model of state, nodes, and edges.
- LangGraph’s workflow and agent patterns, for prompt chaining, routing, parallelisation, orchestrator–worker, and evaluator–optimizer patterns.